
In the world of cybersecurity, Splunk is one of the most popular tools used for data analysis, log management, and security monitoring. For those working in Security Operations Centers (SOCs) or those looking to improve their data analysis capabilities, Splunk is an indispensable tool.
I recently set up Splunk on a Windows 10 VM running in VMware, and in this post, I’ll walk you through the process, along with key features of Splunk that make it an essential tool for any SOC member.

Why Splunk?
Splunk is a versatile data platform that helps organizations aggregate, index, and analyze machine data in real-time. It powers enterprise observability, provides insights for security teams, and allows users to create custom applications.
Splunk’s ability to scale and handle large volumes of data makes it invaluable for cybersecurity professionals, particularly in environments like SOCs, where real-time analysis and actionable insights are critical.
Step 1: Downloading and Installing Splunk on Windows 10 VM
The installation process for Splunk on a Windows 10 virtual machine is relatively straightforward. Here’s how I set it up:
- Create a Splunk Account: First, you need to go to the Splunk website and create an account.
- Download the MSI Installer: After logging in, download the Splunk MSI installer for Windows.
- Accept the License Agreement: Splunk will prompt you to accept its license agreement, so make sure to review it.
- Customize the Installation: During the installation process, you can choose to customize certain settings. I selected the “Customize Options” even though I kept most of the default configurations.
- Install Splunk: Choose the location for your installation and set your credentials. Once installed, Splunk will run as a local system on your Windows machine.
- Accessing Splunk: After installation, you can access the Splunk interface by navigating to
https://127.0.0.1:8000in your browser. This is where you’ll be able to start searching and interacting with your logs.

Step 2: Setting Up Data Forwarding with Splunk Universal Forwarder
Splunk’s Universal Forwarder allows you to send data from remote machines to your Splunk instance for analysis. For my setup, I installed the Universal Forwarder on a Windows 10 machine and configured it to send logs to the Splunk server running in VMware.
Here’s how to do it:
- Download the Forwarder: Go to the Splunk website and download the Universal Forwarder installer.
- Install the Forwarder: Follow the installation steps, accept the license agreement, and specify the Splunk server IP and port (default is 9997).
- Service Check: After installation, check the
services.mscconsole to ensure that the “SplunkForwarder” service is running. - Verify the Connection: You can check if the connection is successful using the
Test-NetConnectioncommand in PowerShell.
Once configured, the Universal Forwarder will begin sending logs to your Splunk instance, allowing you to centralize data for analysis.

Step 3: Creating Dashboards and Alerts in Splunk
After installing Splunk and forwarding data, you can leverage some of its most powerful features: Dashboards and Alerts.
- Dashboards: Dashboards allow you to visualize your data and create panels that display key metrics. You can customize dashboards to display security events, log analysis, or other operational data.
- Alerts: Splunk can trigger alerts based on search criteria. For example, you can set up an alert to notify you if failed login attempts exceed a certain threshold. Alerts can be scheduled or configured to run in real-time.

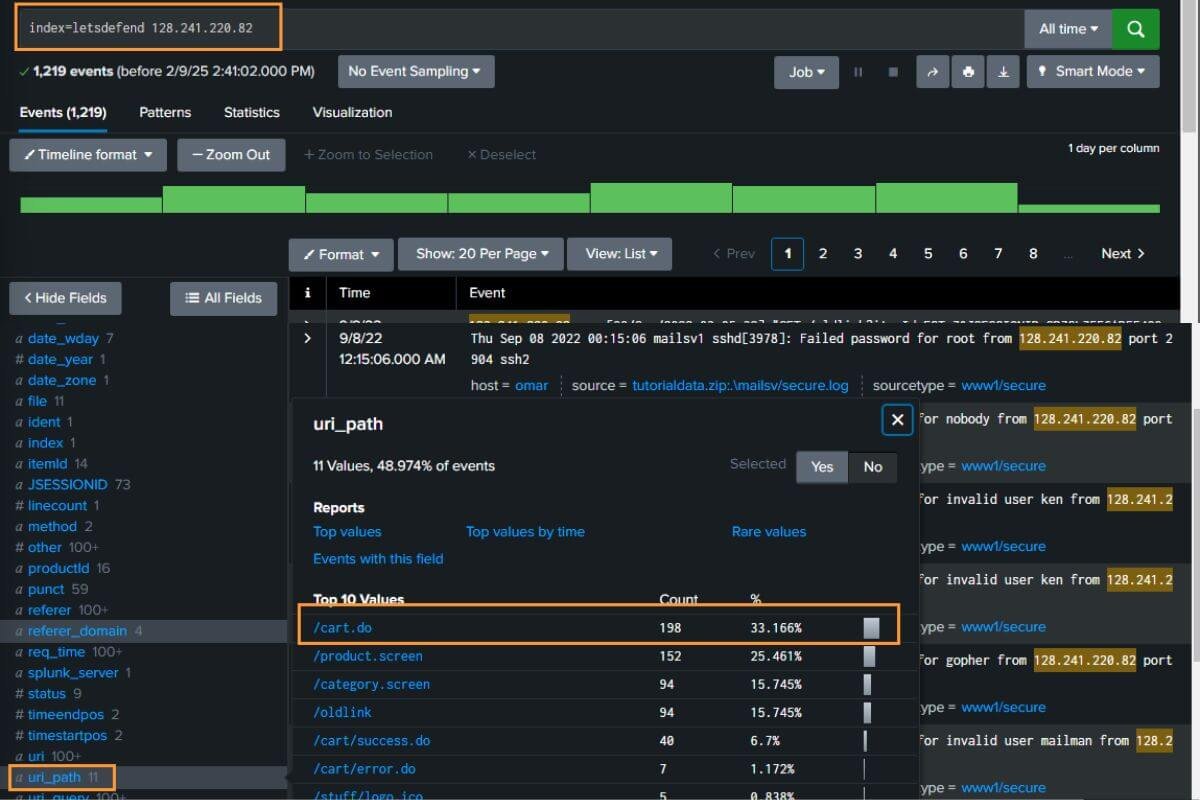
Step 4: Searching and Analyzing Data
One of Splunk’s core features is its powerful search capability. With the search bar, you can query logs, filter data, and analyze events to identify potential security incidents. Splunk allows you to:
- Use wildcards (
*) and operators like AND, OR, and NOT to refine your searches. - Specify time ranges for your searches (e.g., last 24 hours, or specific date ranges).
- Run searches in real-time to catch events as they occur.
Once you run a search, you can save it as a report or use it in a dashboard.
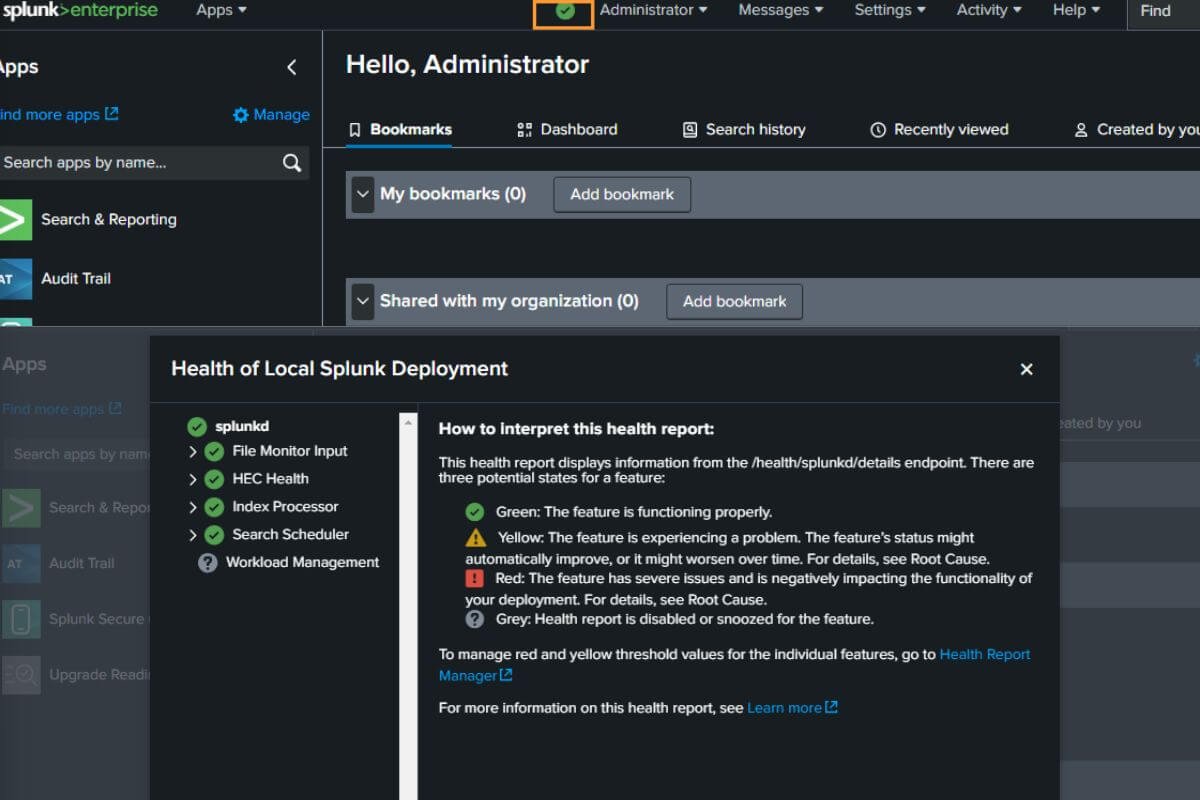
Step 5: Monitoring Splunk Health and Managing Users
Finally, ensuring the health of your Splunk instance is essential for continuous monitoring and data analysis. You can check the health status of your Splunk instance via the administrative dashboard, which shows the status of various services and resources.
Additionally, user management is an important aspect of securing your Splunk instance. By setting up roles and permissions, you can control who has access to specific data and features.
Conclusion
Setting up Splunk on a Windows 10 VM is a fantastic way to dive into the world of data analysis, log management, and security monitoring. With powerful features like data forwarding, dashboards, alerts, and real-time search, Splunk provides everything you need to enhance your monitoring and security workflows.
If you’re working in a SOC or handling cybersecurity, mastering Splunk will give you the tools to detect, investigate, and respond to incidents more efficiently. Whether you’re setting up for personal use or scaling up for enterprise deployment, Splunk is an essential tool in the world of data-driven security.


Leave a Reply