

Project Type: Windows Admin Center | Performance Monitoring | Service Management
Skill Level: Intermediate
Lab Platform: Hyper-V + VMware + Windows Server 2022
Why I Built This
Day 10 of my 10-day hands-on IT lab series focuses on using Windows Admin Center (WAC) for centralized management and monitoring of my virtual lab environment. WAC provides a unified dashboard to manage all of your virtual machines (VMs) and servers, making it easier to monitor performance, updates, and services.
This day I installed WAC on my Domain Controller (DC), added all lab VMs to the dashboard, and learned how to simulate and troubleshoot issues such as slow system performance and service failures, which are critical skills for IT administrators.
Lab Setup Overview
| Component | Details |
|---|---|
| Hypervisor | Hyper-V (Main Hypervisor) |
| VMware Platform | VMware Workstation Pro |
| Domain Name | wired.com |
| Subnet | 192.168.1.0/24 |
| DC IP Address | 192.168.1.10 (Static) |
| Client DNS | 192.168.1.10 (Domain Controller) |
| New Clients | NYC-CLI1, FL-CLI1 (Windows 10/11 on VMware) |
Step-by-Step Breakdown
Phase 1: Install Windows Admin Center on Your Main Host or DC
- Download Windows Admin Center:
- Go to the Windows Admin Center download page and download the installer.
- Run the installer on your Domain Controller (DC) or main host.
- Choose Installation Options:
- Install on your primary machine or DC.
- Complete the installation by following the on-screen steps.
- Configure Firewall Settings
- Result: Windows Admin Center is installed and ready to manage your virtual environment.
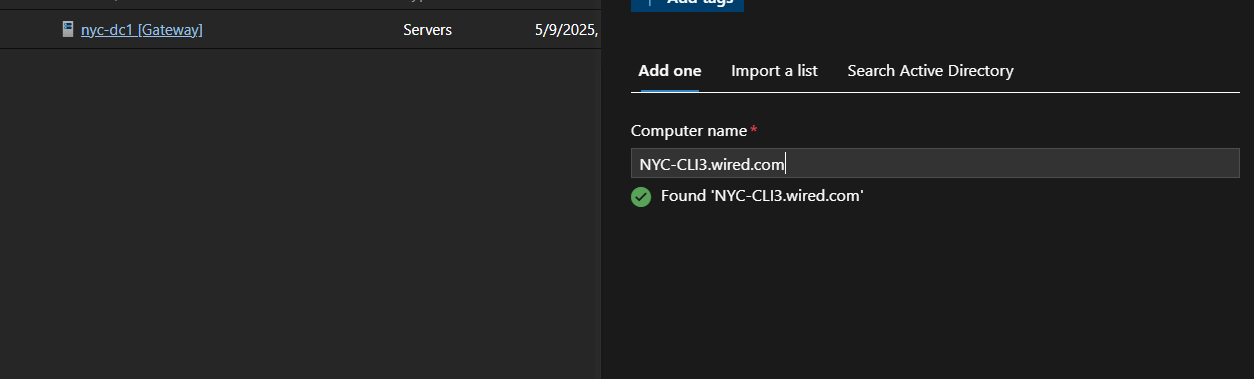
Phase 2: Add All Lab VMs to the Dashboard
- Open Windows Admin Center.
- Click on Add at the top of the WAC window.
- Select the type of resource to add:
- Choose Servers for domain controllers and VMs.
- You can also add Windows PCs for non-server VMs (e.g., your Windows client machines).
- Provide necessary credentials for each server/VM:
- Use administrative credentials (e.g., 192.168.x.x or the FQDN) for each VM.
- Repeat for all VMs:
- Add each lab VM, including both clients and servers, to the dashboard.
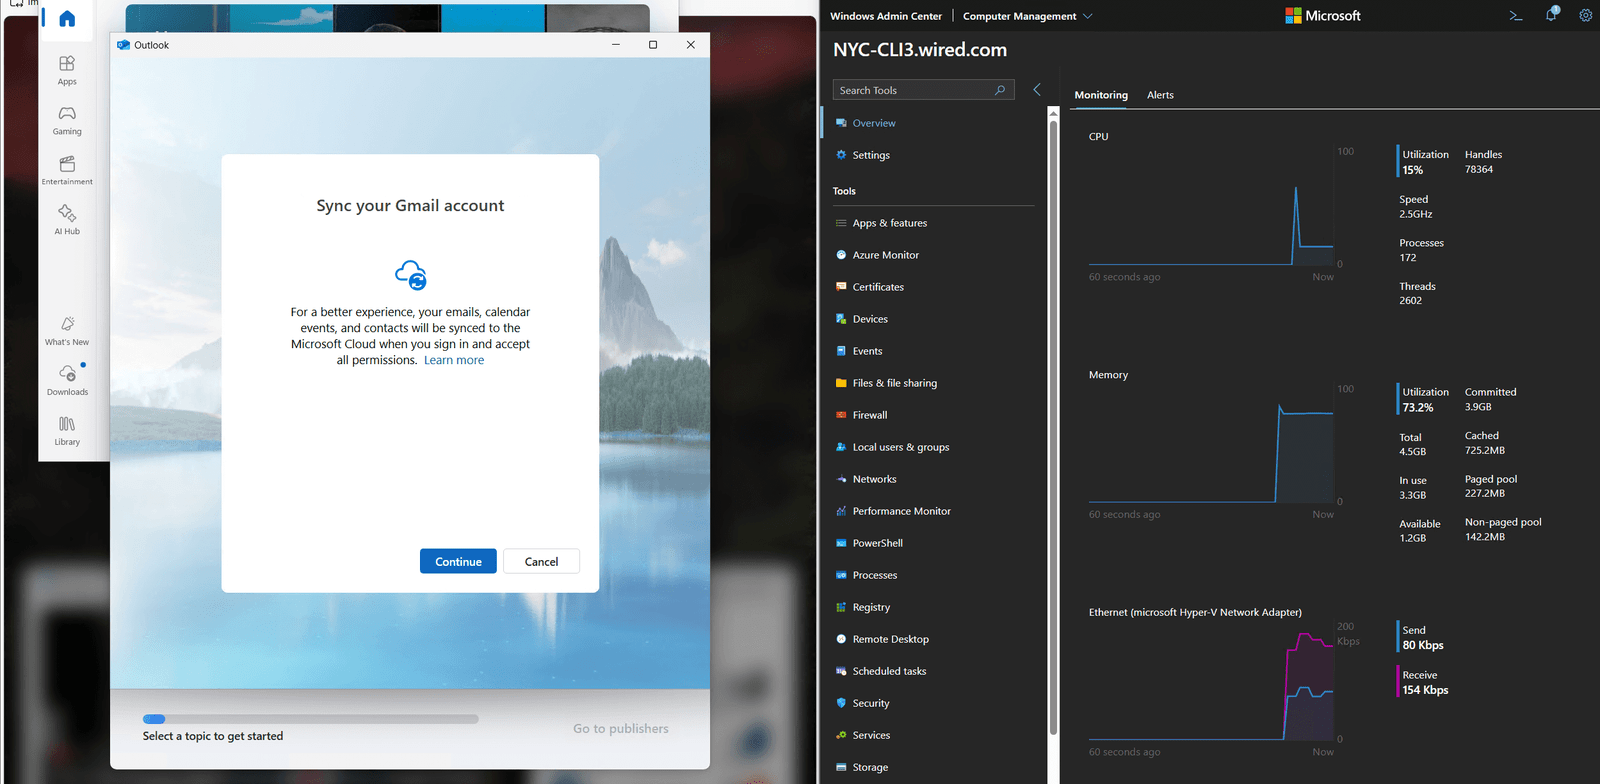
Phase 3: Monitor Performance, Updates, and Services
- Performance:
- Go to the Performance tab in Windows Admin Center.
- Select each VM or server to view metrics such as CPU usage, memory usage, disk I/O, etc.
- Updates:
- Go to the Updates section in the dashboard.
- Check the status of Windows updates for each connected VM.
- You can deploy updates or see if any machines are behind on patches.
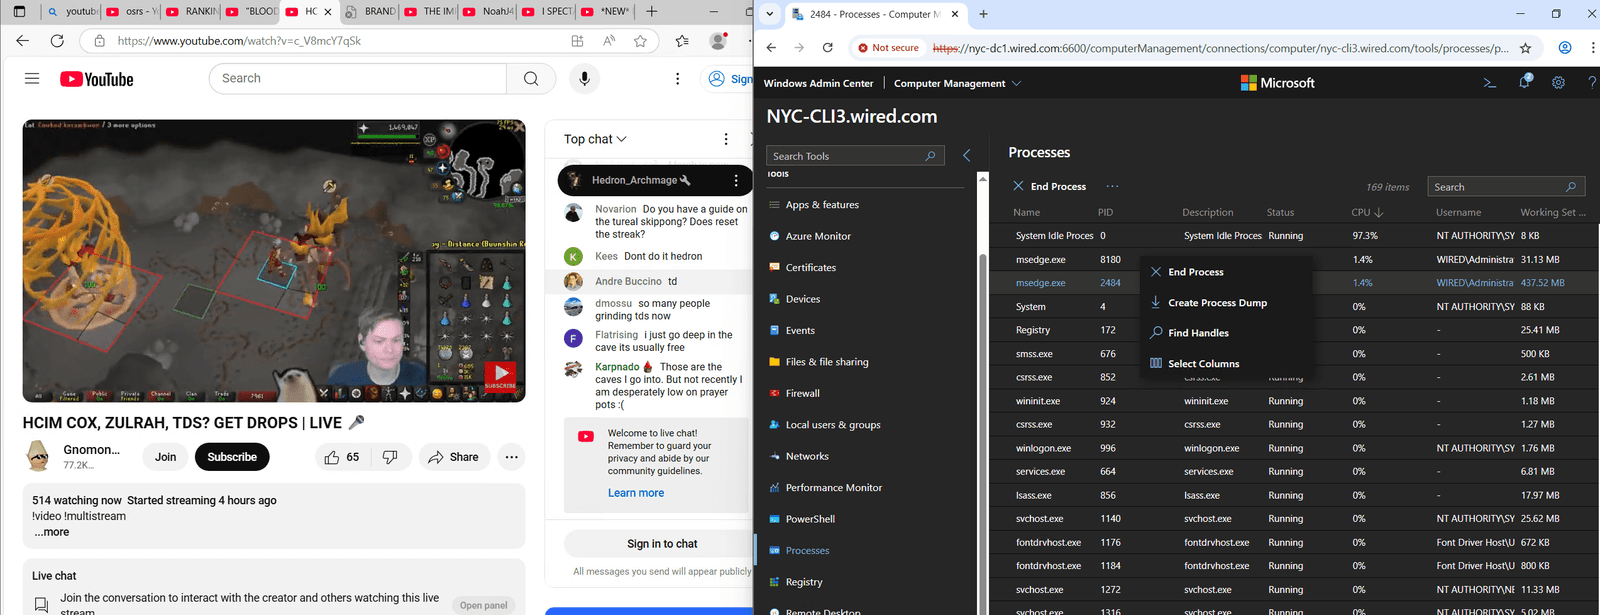
- Services:
- Monitor services running on each machine.
- You can start, stop, or restart services directly through the WAC interface.
- Look for critical services (e.g., DNS, DHCP, Active Directory services) that might affect performance.
Phase 4: Simulate and Troubleshoot a Slow System or Service Failure
- Simulate a Slow System:
- Use WAC to monitor resource usage (CPU, memory, disk) on any VM.
- Create a scenario by consuming excessive resources (e.g., running a large program or using high memory).
- Diagnose the Issue:
- Use Windows Admin Center’s performance monitor to identify which resources are over-utilized.
- Troubleshoot the Issue:
- Stop services or shut down applications directly through WAC to resolve high resource consumption.
- Simulate a Service Failure:
- Manually stop an important service (e.g., DNS or DHCP).
- Check the status of the service using WAC’s Services tab.
- Restart the service or troubleshoot using event logs (which you can view directly in WAC).
- Test the Recovery Process:
- Restart services, check logs, and ensure that the system is restored to full functionality.
Key Problems Solved
- Centralized Management: Installed Windows Admin Center (WAC) and added all lab VMs for centralized management and monitoring.
- Performance Monitoring: Used WAC to monitor CPU usage, memory, and disk I/O across all VMs to ensure optimal performance.
- Service Management: Managed services on all machines directly through WAC, allowing me to start, stop, and troubleshoot services remotely.
Troubleshooting Tips
- Slow System Diagnosis:
- Use WAC’s performance tab to identify which resource (CPU, memory, or disk) is being over-utilized.
- You can shut down high-usage applications directly through WAC to free up resources.
- Service Failure Troubleshooting:
- If services fail, use WAC’s Services tab to restart them directly.
- Check Event Viewer logs for deeper insights into the failure and resolve the issue by restarting services or fixing underlying causes.
What I Learned
- Windows Admin Center: How to install and use WAC to manage, monitor, and troubleshoot virtual machines and servers in a lab environment.
- Performance & Services Monitoring: The importance of using centralized monitoring to keep track of system performance, updates, and service health.
- Troubleshooting Skills: How to simulate and troubleshoot slow systems or service failures using WAC tools.
Follow the Journey
This blog post marks the end of my Real-World IT Lab in 10 Days series. Throughout this journey, I’ve gained valuable hands-on experience in Windows Server, network management, Active Directory, and virtualization, simulating real-world IT scenarios and building an environment that mirrors enterprise-level IT infrastructure.
While this series concludes today, the learning and experimentation continue. I’ll continue refining my skills, exploring new tools, and tackling more complex challenges.
Stay connected for future updates, and follow me on LinkedIn for more insights into my ongoing IT and cybersecurity journey.
Thank you for following along!
Follow me on LinkedIn for more updates and insights!


Leave a Reply