As a SOC (Security Operations Center) analyst, gaining hands-on experience with a range of cybersecurity tools and configurations is key to mastering the field. I already had a basic Active Directory home lab, but I wanted to take it further. My goal was to challenge myself with more tools and processes that mimic real-world cybersecurity scenarios. Here’s a step-by-step breakdown of how I built a SOC analyst environment with various tools.
1. Initial Setup and Logical Diagram
To start, I created a logical diagram that detailed all the components of my SOC environment. The setup used Vultr, a cloud service provider (CSP), where I could spin up 8 different servers to create a fully functional SOC. Here’s the breakdown:
- SOC Analyst Laptop: The central device for monitoring and responding to incidents.
- Attacker Laptop: Running Kali Linux to simulate attacker activities.
- C2 Server (Mythic): Used to control compromised systems via command and control.
- ELK/Kibana Server: For logging and analyzing security events.
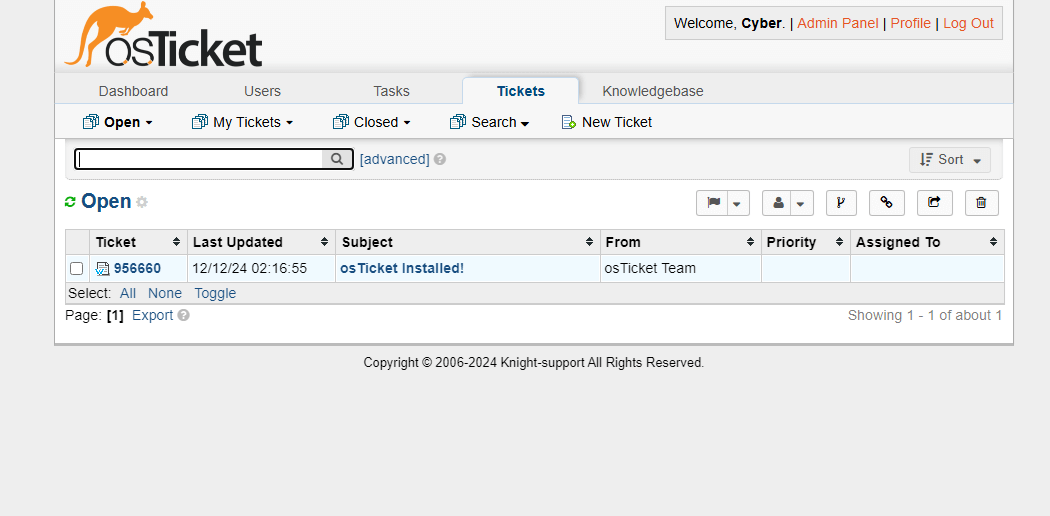
- Ticketing System (OSTicket): To manage security incidents.
- Fleet Server: For managing the agents collecting logs.
I placed all these servers inside a VPC (Virtual Private Cloud) with a private network, using the IP range 172.31.0.1-254 and subnet mask 255.255.255.0. Outside of the VPC, I also had Windows RDP and Ubuntu SSH servers for added flexibility.

2. Creating a Vultr Account and Cloud Setup
After planning my network, I created a Vultr account and received a $300 free credit. This was great because it allowed me to explore cloud environments without the immediate financial burden. While my laptop has 64GB of RAM, which would have been sufficient for this project locally, I wanted to gain experience with cloud infrastructure and CSPs. In the future, I plan to run on-prem SIEM projects, but for now, this was an excellent opportunity.
Once I was in, I created a VPC Network in Vultr with the network range mentioned above, ensuring that my ELK, ticketing system, and fleet server all ran inside this network. I chose Ubuntu 22.04 LTS x64 for my server OS.

3. Setting Up the ELK Stack
With my VPC set up, I began by configuring the ELK Stack, starting with Elasticsearch.
Installing Elasticsearch
- SSH Access: I SSH’ed into the server console.
- Download Elasticsearch: I used the following link to download the Debian package for Elasticsearch:bashCopy code
wget https://artifacts.elastic.co/downloads/elasticsearch/elasticsearch-7.10.2-amd64.deb - Configuration: I opened the
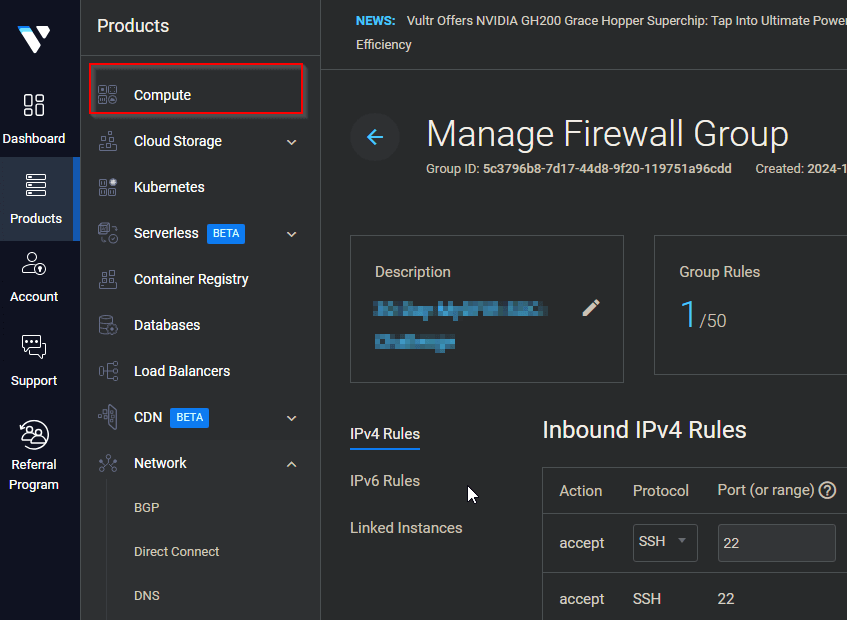
elasticsearch.ymlconfiguration file to set the port to 9200 and ensure that it would listen on the right interfaces. - Firewall Configuration: Back in Vultr, I created a firewall rule to allow my public IP to access the network over SSH/Port 22.
- Start Elasticsearch: On the command line, I ran the following commands:bashCopy code
sudo systemctl enable elasticsearch.service sudo systemctl start elasticsearch sudo systemctl status elasticsearchThis confirmed that Elasticsearch was up and running successfully.


Installing Kibana
Next, I set up Kibana, the interface for visualizing and interacting with Elasticsearch data:
- Download Kibana: I used the following command to download the Debian package for Kibana:bashCopy code
wget https://artifacts.elastic.co/downloads/kibana/kibana-7.10.2-amd64.deb - Configuration: I edited the
kibana.ymlconfiguration file and set the server.port to 5601. - Start Kibana: After configuring Kibana, I ran the following commands:bashCopy code
sudo systemctl daemon-reload sudo systemctl enable kibana.service sudo systemctl start kibana.service sudo systemctl status kibana.serviceThis confirmed that Kibana was running and accessible.

4. Configuring Firewalls for Security
To ensure that only trusted IPs could access my ELK/Kibana stack, I configured firewalls both in Vultr and within the ELK server itself.
- Vultr Firewall: I configured the firewall to allow my public IP to access both SSH (Port 22) and TCP (Port 5601) for Kibana access.
- Local Firewall: Inside the ELK server, I used UFW (Uncomplicated Firewall) to explicitly allow incoming traffic on port 5601:bashCopy code
sudo ufw allow 5601/tcp
This ensured that Kibana was both secure and accessible from my laptop for monitoring.

5. Integrating Mythic C2 for Simulating Attacks
After the ELK stack was up and running, I moved on to simulate an attacker environment using Mythic C2.
- Set Up Mythic C2 Server: I deployed Mythic C2 on another server. This would allow me to simulate attacker behavior, control compromised machines, and test the detection capabilities of my SOC environment.
- Payloads: I created a malicious payload (e.g.,
svchost-knight.exe) on the Mythic server and executed it on a compromised machine. Using Mythic’s CLI, I could monitor activity on the victim machine and exfiltrate data (like passwords).

6. Building the Incident Management System with OSTicket
Next, I set up OSTicket, a ticketing system for managing security incidents.
- Deploy Windows Server: I used a Vultr Windows server to host the OSTicket application.
- Install XAMPP: On the Windows server, I installed XAMPP to run Apache and MySQL.
- Install OSTicket: I downloaded OSTicket, configured the database, and uploaded the necessary files to the server.
- Integration: To streamline security incident handling, I integrated ELK with OSTicket to automatically create tickets when specific alerts were triggered.

7. Implementing Elastic EDR for Endpoint Protection
As the final layer of protection, I installed Elastic EDR (Endpoint Detection and Response) to monitor endpoints and respond to threats proactively.
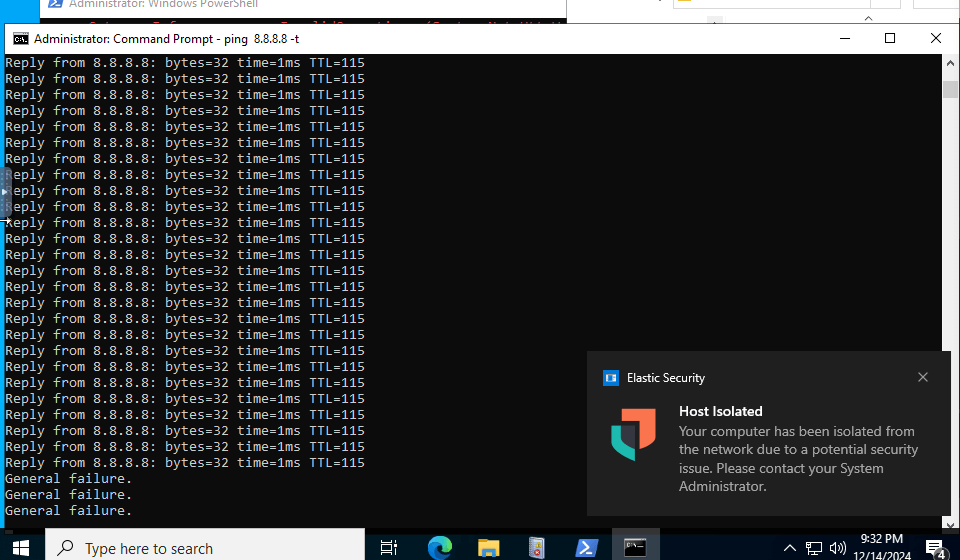
- Elastic Defend: In the Elastic Security module, I configured Elastic Defend for Windows endpoints, assigning a policy to protect against malicious activities.
- Test EDR: I tested the system by executing the malicious
svchost-knight.exepayload. The Elastic EDR immediately detected and blocked the execution, preventing further compromise.

8. Monitoring and Alerting
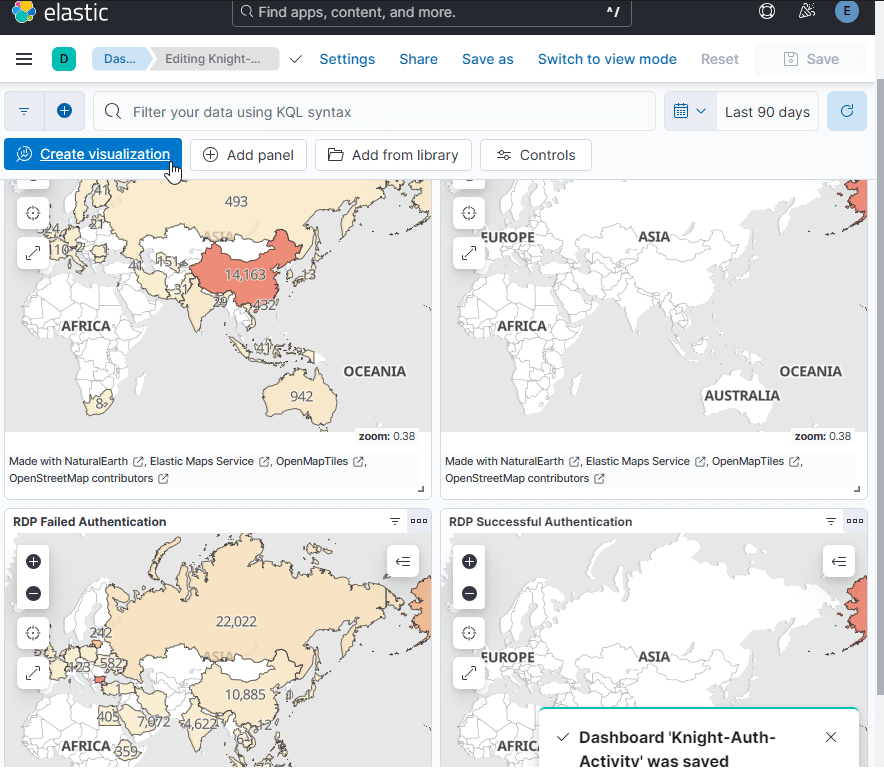
With everything in place, I began setting up alerts and dashboards in Kibana. I created specific alerts for actions like brute force attacks, mythic agent callbacks, and other suspicious behaviors. These alerts were configured to trigger when specific event patterns or logs were detected, ensuring that the SOC could respond to any potential threats in real time.

9. Clean Up and Cost Management
Finally, once everything was set up and tested, I tore down the environment to ensure I wasn’t racking up unnecessary charges. It’s crucial to monitor cloud resources closely, and after tearing everything down, I checked my Vultr account to ensure that the balance remained stable and no unexpected charges occurred.

Conclusion
Building this SOC environment was a massive and rewarding project. It gave me hands-on experience with various security tools like ELK Stack, OSTicket, Elastic EDR, and Mythic C2. The integration of these tools created a comprehensive security monitoring and incident response setup.
This project not only deepened my understanding of cybersecurity concepts but also prepared me for certifications like CompTIA CySA+. The lessons learned from setting up and managing this SOC environment are invaluable for anyone looking to break into the field of security operations.


Leave a Reply